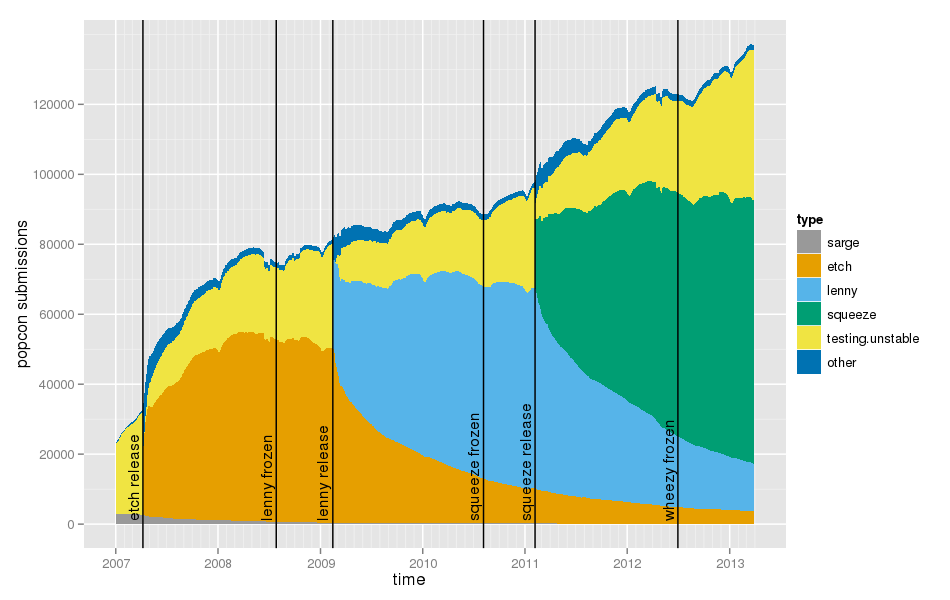
The graph below is generated from popcon submissions. Since they include the version of the popularity-contest package, one can determine the Debian release that was used by the submitter (a new version of the popularity-contest package is generally uploaded just after the release to make that tracking possible).
The graph is similar to the one found on popcon, except that versions newer than the latest stable release are aggregated as “testing/unstable”.
Comments:
- Popcon submitters might not be representative of Debian users, of course.
- There’s quite a lot of testing/unstable users, and their proportion is quite stable:
- Today: testing/unstable: 43119 submissions (31.4%); squeeze: 75454 (54.9%); lenny: 13603 (9.9%)
- 2011-02-04 (just before the squeeze release): testing/unstable: 29012 (29.7%); lenny: 57262 (58.6%); etch: 10032 (10.3%)
- 2009-02-13 (just before the lenny release): testing/unstable: 30108 (36.9%); etch: 49996 (61.2%)
- I don’t understand why the number of Debian stable installations does not increase, except when a new release is made. It’s as if people installed Debian, upgraded directly to testing, and switched back to tracking stable after the release. Or maybe people don’t update their systems? A more detailed analysis could be done by looking at the raw popcon data.
- Upgrading to the next stable release takes time. Looking at the proportion of users still using oldstable one year after the release, it would be better not to remove oldstable from mirrors too early.
Scripts are available on git.debian.org.
