It has been raised in various discussions how much it’s difficult to make large-scale changes in Debian.
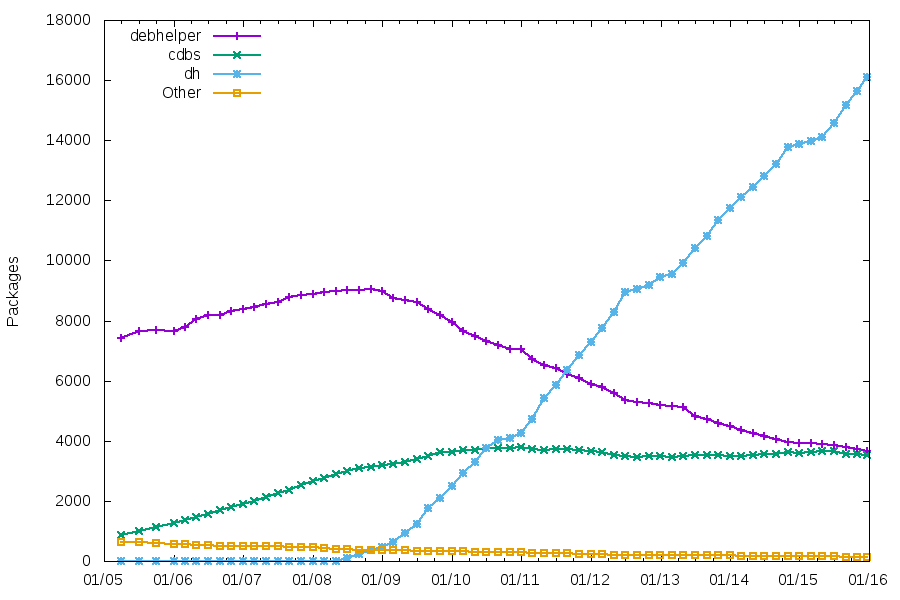
I think that one part of the problem is that we are not very good at tracking those large-scale changes, and I’d like to change that. A long time ago, I did some graphs about Debian (first in 2011, then in 2013, then again in 2015). An example from 2015 is given below, showing the market share of packaging helpers.
Those were generated using a custom script. Since then, classification tags were added to lintian, and I’d like to institutionalize that a bit, to make it easier to track more trends in Debian, and maybe motivate people with switching to new packaging standards. This could include stuff like VCS used, salsa migration, debhelper compat levels, patch systems and source formats, but also stuff like systemd unit files vs traditional init scripts, hardening features, etc. The process would look like:
- Add classification tags to lintian for relevant stuff (maybe starting with being able to regenerate the graphs from 2015).
- Use lintian to scan all packages on snapshot.debian.org, which stores all packages ever uploaded to Debian (well, since 2005), and generate a dataset
- Generate nice graphs
Given my limited time available for Debian, I would totally welcome some help. I can probably take care of the second step (I actually did it recently on a subset of packages to check feasibility), but I would need:
- The help of someone with Perl knowledge, willing to modify lintian to add additional classification tags. There’s no need to be a Debian Developer, and lintian has an extensive test suite, that should make it quite fun to hack on. The code could either be integrated in lintian, or live in a lintian fork that would only be used to generate this data.
- Ideally (but that’s less important at this stage), the help of someone with web skills to generate a nice website.
Let me know if you are interested.
Why not use a standard graphing frontend (like grafana)? That would change the 3rd step to something more like: get the data generated into a time-series database that is compatible with $FRONTEND
Adding such things to Lintian is really quite easy… and no need to fork it! ;-)
@ lamby: sure! but it has been on my To-Do list for literally forever, and it sounds like an easy way to get involved in Lintian and Debian
Probably more related to lintian itself, as input base: Add statistics about dh overrides and add statistics about non-generated maintainer scripts (rough complexity ? wc -l). Both stats might be helpful on the two decade journey towards declarative packaging.